متاتریدر 4
اندیکاتور اصلی
رایگان
بله
همه
همه
وابسته به استراتژی
نامحدود
همه
نامحدود
بله
نامحدود
وابسته به استراتژی
همه
24/5 Online
سیستمی
شماره حساب
بله
Secret SnR
بازار بسیار پویا است و ما باید به دنبال پویایی برای آدرس دهی به بازار باشیم که بسیار تصادفی است.
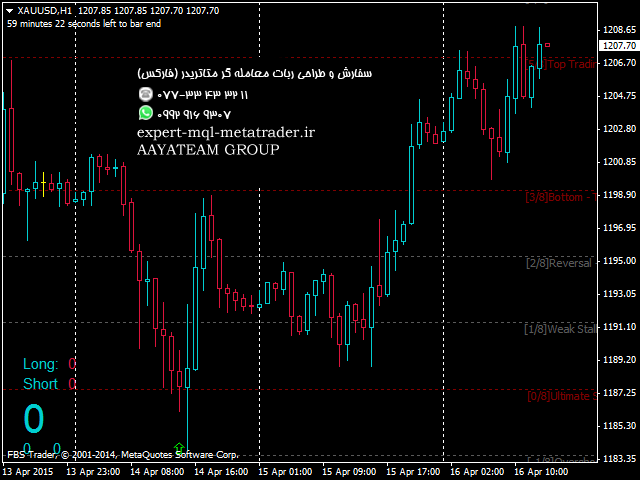
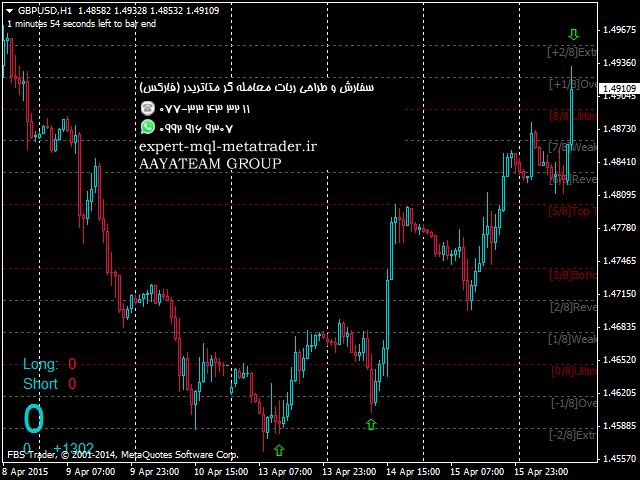
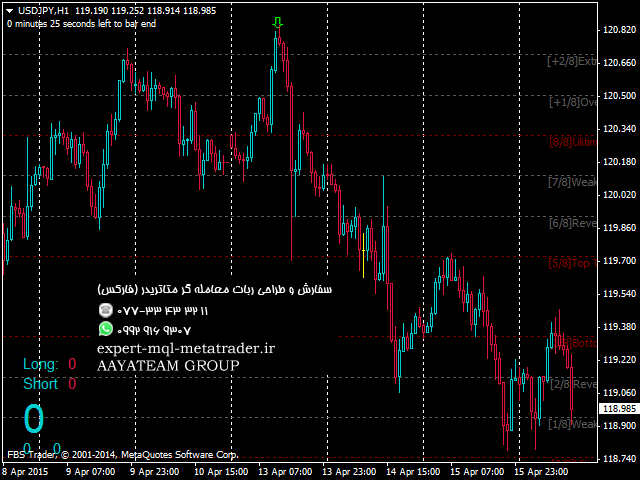
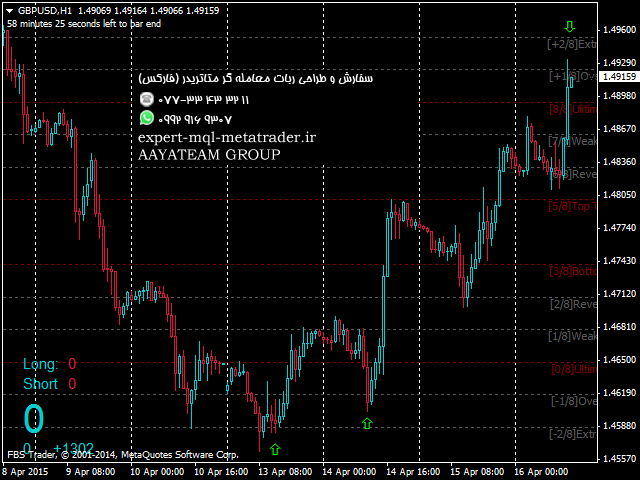
سطح پویا ، توصیف پشتیبانی و مقاومت بر اساس چرخه های زمانی است. این شاخص با نقاط محوری کار می کند. این یک دستیار معامله گر در تعیین حمایت و مقاومت است. این شاخص های پویا از سطوح ، انواع مختلفی از سطوح پشتیبانی و مقاومت را تولید می کند. یکی از خطوط شاخص به منظور نشان دادن محدودیت های پشتیبانی و مقاومت است که از نمودار قابل مشاهده است. انتظار می رود این خط بتواند به طور مداوم بین نقاط پشتیبانی و نقطه مقاوم تمایز قائل شود.
تعریف سطوح در خط سطح پویا:
۱٫ خط ۸/۸/۸ ۰ & (پشتیبانی نهایی و مقاومت نهایی). این خط را می توان قوی ترین پشتیبانی/مقاومت دانست.
۲٫ خط ۷/۸ (ضعیف ، محل توقف و برگشت). یک خط ضعیف اگر ناگهان قیمت خیلی سریع و خیلی دور حرکت کند و سپس در اینجا متوقف شود ، خط را می توان به این معنا که قیمت به زودی تغییر می کند ، تفسیر کرد. اگر قیمتها در نزدیک خط متوقف نشوند ، قیمت حرکت خود را به خط ۸/۸ ادامه می دهد.
۳٫ ۱/۸ خط (ضعیف ، محل توقف و برگشت). یک خط ضعیف اگر ناگهان قیمت خیلی سریع و خیلی دور حرکت کند و سپس در اینجا متوقف شود ، خط را می توان به این معنا که قیمت به زودی تغییر می کند ، تفسیر کرد. اگر قیمتها در نزدیکی خط متوقف نشوند ، قیمتها حرکت خود را به سمت ۰/۸ ادامه می دهند.
۴٫ خطوط ۲/۸ و ۶/۸ (Pivot ، Reverse). اگر قیمت بین خطوط ۲/۸-۴/۸ یا ۶/۸-۴/۸ حرکت می کند ، این دو خط را برای حرکت با خط ۴/۸ تغییر دهید.
۵٫ خط ۵/۸ (بالای محدوده تجارت). قیمت ۴۰ درصد از کل حرکت بین خط ۵/۸ و ۳/۸ را صرف کرد. اگر قیمت در محدوده خط ۵/۸ به مدت ۱۰-۱۲ روز متوقف یا متوقف شود ، این را می توان به عنوان منطقه ای برای تلاش برای گرفتن موقعیت فروش تفسیر کرد (برخی از افراد این کار را انجام می دهند). اما اگر قیمت در ۸/۵ به سمت بالا حرکت کند ، می توان تفسیر کرد که قیمت تا سطح مقاومت بعدی ادامه می یابد.
۶٫ خط ۳/۸ (پایین محدوده معاملاتی). اگر قیمت زیر این خط و در شرایط روند صعودی باشد ، می توان اینگونه تفسیر کرد که شکستن این سطح بسیار دشوار خواهد بود. اگر قیمت در یک روند صعودی این سطح را بشکند و برای ۱۰-۱۲ روز از آن سطح بالاتر بماند ، می توان اینگونه تفسیر کرد که قیمت بین ۳/۸ تا ۵/۸ در ۴۰ درصد مواقع حرکت می کند.
۷٫ خط ۴/۸ (خطوط اصلی پشتیبانی/مقاومت). خط اصلی پشتیبانی/مقاومت است. این برای سطح ابتدایی ، فروش یا خرید خوب است. هنگامی که قیمتها بالاتر از ۴/۸ هستند ، پشتیبانی قوی است و هنگامی که قیمت زیر ۴/۸ است مقاومت قوی است.
محدوده معاملاتی (۵/۸ ″ و ۳/۸) pertama2 ممکن است کمی گیج کننده باشد وقتی بیشتر حرکت قیمت خارج از خطوط است. اما در واقع این خطوط برای تعیین احساسات بازار بسیار مهم هستند. اساساً ، وقتی بازار بین خطوط است ، این بدان معناست که احساسات بازار مسطح یا پهلو است. اگر بالای خط ۵/۸ باشد ، بازار را می توان صعودی دانست ، برعکس ، در زیر ۳/۸ ، بازار نزولی است. خط دیگر ۵/۸ است اگر بخواهیم وارد بازار صعودی شویم ، پشتیبانی قوی است و برعکس ۳/۸ زمانی که می خواهیم وارد بازار نزولی شویم ، یک مقاومت قوی است.
شکستن این خطوط می تواند بسیار مهم باشد. به عنوان مثال ، اگر قیمت برای مدتی بالاتر از ۸/۵ باشد و سپس آن را به سمت پایین بشکند ، این نشانه این است که قدرت صعودی شروع به اتمام می کند. معمولاً همیشه تا سطح ۴/۸ دنبال می شود ، و اگر چنین باشد ۵/۸ مقاومت قابل توجهی است. اگر قیمتها مجدداً از طریق ۵/۸ دوباره به سطح خود برسند ، قیمتها سعی می کنند مجدداً در شرایطی که قبلاً صعودی شکست خورده بود ، دوباره یک حالت صعودی را آزمایش کنند.
The market is very dynamic and we need to think of a dynamic for addressing market that is so random.
Dynamic Level is the depiction of Support and Resistance based on Time Cycles. The indicator works with Pivot points. It is a trader’s assistant in determining support and resistance. This dynamic indicators of levels produces several types of support and resistance levels. One of the indicator lines is meant to show the limits of support and resistance that could be seen from the chart. The line is expected to be able to distinguish between the points of support and resistant point continuously.
The definition of the levels in the Dynamic Level Line:
- ۱٫ Line 8/8/8 0 & (Ultimate Support and Ultimate Resistance). This line can be counted as strongest Support/Resistance.
- ۲٫ Line 7/8 (Weak, the Place to Stop and Reverse). A weak line. If suddenly price moves too fast and too far and then stops here, then the line can be interpreted as the price will soon turn around. If prices do not stop near the line, the price will continue its movement to line 8/8.
- ۳٫ ۱/۸ Line (Weak, the Place to Stop and Reverse). A weak line. If suddenly price moves too fast and too far and then stops here, then the line can be interpreted as the price will soon turn around. If prices do not stop near the line, then the prices will continue their movement to the 0/8.
- ۴٫ Lines 2/8 and 6/8 (Pivot, Reverse). These two lines to swing a trade with the line 4/8 if the price moves in between the lines 2/8-4/8 or 6/8-4/8.
- ۵٫ Line 5/8 (Top of Trading Range). Price spent 40% of all movement between line 5/8 and 3/8. If the price moves or stops around 5/8 line for 10-12 days, this can be interpreted as a zone to try to grab a Sell position (there are some people who do this). But if the price moves upward at 5/8, then it can be interpreted that the price will continue to the next resistance level.
- ۶٫ Line 3/8 (Bottom of Trading Range). If the price is below this line and in conditions of an uptrend, it can be interpreted as the price will be very difficult to break this level. If price breaks this level in an uptrend and stays above that level for 10-12 days, then can be interpreted as the price will move between 3/8 and 5/8 for 40% of the time it’s movement.
- ۷٫ Line 4/8 (Major Support/Resistance lines). Is a major line of support/resistance. This is good for the entry level, sell or buy. It is strong support when prices are above 4/8 and a strong resistance when the price is below 4/8.
The Trading Range (5/8″ and 3/8) pertama2 may be a little confusing when most of the price movement is outside the lines. But actually these lines are very important for determining the market sentiment. Basically, when the market is between the lines this means market sentiment is flat or sideway. If it is above a line 5/8, the market can be considered bullish, conversely, under 3/8, the market is bearish. The other line is 5/8 is a strong support if we’re willing to enter the market which is bullish, and vice versa 3/8 is a strong resistance when we want to enter the market which is bearish.
Breaking of these lines can be very important. For example, if the price is above the 5/8 for some time and then breaks through it downwards, it is a sign that the bullish power starts to run out. Usually always will be followed to the level 4/8, and if that is the case then 5/8 is a significant resistant. If the prices then to level again through 5/8 again, then prices try to re-test a bullish mode again where previously bullish failed.
تماس و واتس آپ اکسپرت سفارشی: ۰۷۷۳۳۴۳۳۲۱۱ – ۰۹۹۲۹۱۶۹۳۰۷
برچسب ها: سفارش ساخت ربات فارکس و ساخت ربات معامله گر بورس و ساخت ربات معاملاتی و طراحی ربات تریدر و ربات فارکس رایگان و برنامه نویسی ربات فارکس و آموزش ساخت اکسپرت فارکس و ساخت ربات معامله گر با پایتون و دانلود ربات معامله گر فارکس و خرید ربات تریدر فارکس و ربات فارکس خودکار و ربات معامله گر بورس رایگان و آموزش ساخت ربات معامله گر فارکس و دانلود ربات معامله گر بورس ایران و ربات معامله گر آلپاری و ربات فارکس برای اندروید و طراحی ربات متاتریدر و برنامه نویسی ربات متاتریدر و طراحی ربات فارکس و برنامه نویسی ربات فارکس و تجارت خودکار

