متاتریدر 4
اندیکاتور اصلی
رایگان
بله
همه
همه
وابسته به استراتژی
نامحدود
همه
نامحدود
بله
نامحدود
وابسته به استراتژی
همه
24/5 Online
سیستمی
شماره حساب
بله
Price Action Strength Indicator
شاخص قیمت عملکرد قوی از خالص ترین شکل داده های موجود در بازار (عمل قیمت) برای نشان دادن قدرت حرکت در بازار استفاده می کند. خواندن عملکرد قیمت و اندازه گیری قدرت آن یک موضوع ذهنی است و تسلط بر آن سالها طول می کشد. هدف این شاخص این است که قرائت قدرت قیمت را تا آنجا که ممکن است عینی کند.
اندیکاتور نسبت به نوسان سازهای پیش فرض بسیار پیشرفته تر است ، زیرا علاوه بر حرکت قیمت و جهت آن ، شاخص Price Action Strength ویژگی های حرکت را بررسی می کند. این به شما امکان می دهد بازار را از نگاه یک معامله گر با تجربه قیمت مشاهده کنید.
نسخه جدید از همان ارزش عملکرد اقدام قیمت نسخه ۱٫۰ استفاده می کند ، اما نسخه ۲٫۰ احساس بازار را برای شما تعیین می کند. ۲ احساس ممکن است:
پیش بینی/معکوس کردن احساسات ، که با استفاده از قله ها/قله های اخیر قیمت در مقایسه با ارزش قوت عمل قیمت محاسبه می شود.
احساس تداوم/حرکت ، که با استفاده از شتاب و ارزش Price Action Strength محاسبه می شود.
نسخه جدید از این تشخیص احساسات برای ایجاد فلش هایی در نمودار استفاده می کند که نشان می دهد بازار با استفاده از تجزیه و تحلیل قیمت محض به کجا حرکت می کند.
علاوه بر ۲ بافر موجود در نسخه ۱٫۰ ، ۳ نوع پیکان/بافر با نسخه جدید (یکی برای هر جهت) وجود دارد:
بافر قدرت قدرت نسبی عمل قیمت را در مقایسه با مقدار “دوره” ورودی شمع های گذشته محاسبه می کند. اطلاعات با استفاده از یک خط در پنجره جداگانه تجسم می شود. حرکت صعودی این خط نشان دهنده قدرت صعودی قیمت است در حالی که حرکت نزولی این خط نشان دهنده قدرت عملکرد نزولی است. هر چه این خط بالاتر باشد ، قدرت عمل قیمت بیشتر صعودی است ، خط پایین تر است ، قدرت عمل قیمت نیز بیشتر نزولی است.
بافر همپوشانی ، همپوشانی نسبی میله های جاری را در مقایسه با مقدار “دوره” ورودی شمع های گذشته محاسبه می کند. اطلاعات با استفاده از هیستوگرام تجسم می شوند. هرچه هیستوگرام بالاتر باشد ، قدرت عمل قیمتی با توجه به همپوشانی میله ها قوی تر است. به عبارت دیگر ، هرچه هیستوگرام بیشتر شود ، همپوشانی کمتری بین میله ها وجود دارد ، به این معنی که قیمت جهت مشخصی دارد و محدوده ای ندارد ، که نشان دهنده یک حرکت قوی است.
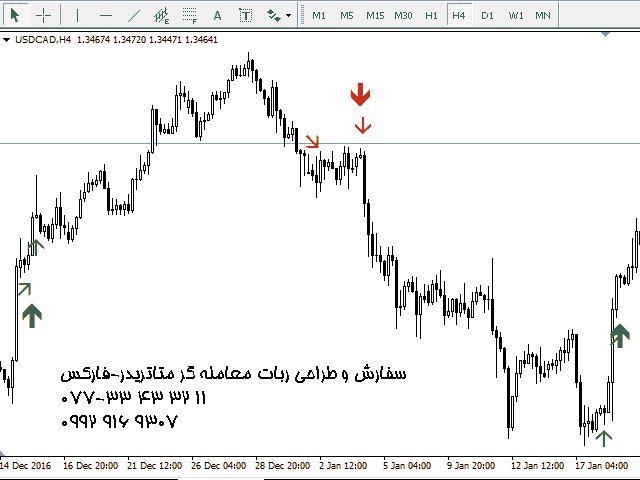
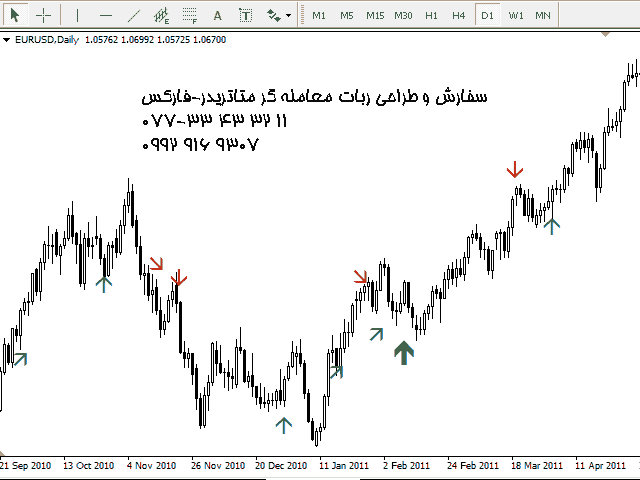
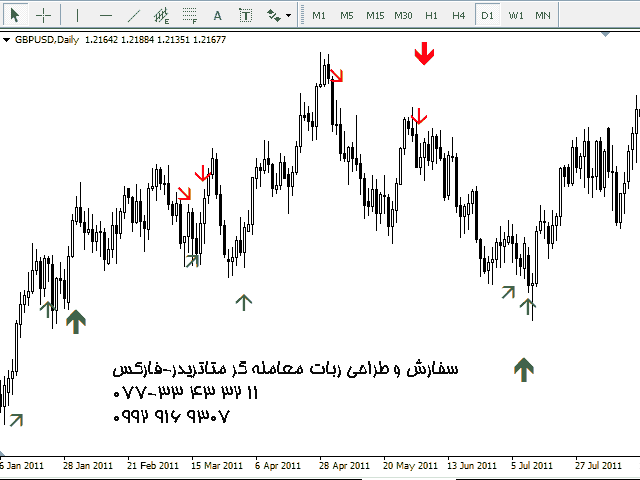
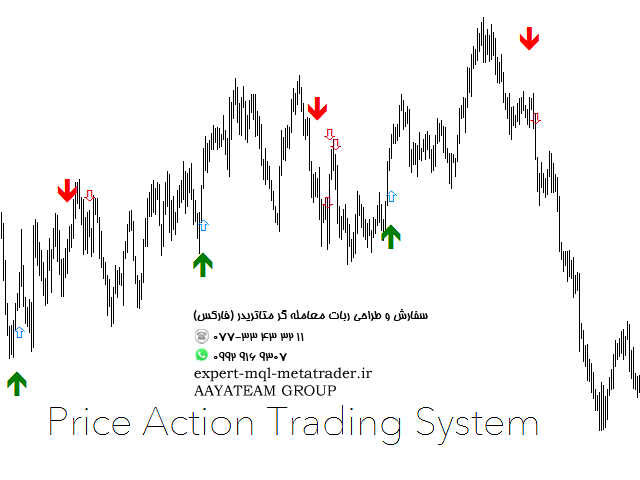
بافر معکوس با یک پیکان نازک به بالا/پایین نشان داده شده است. پیکان معکوس نشان می دهد که احتمال برگشت قیمت وجود دارد. سیگنال های معکوس آنهایی هستند که بیشترین سیگنال های کاذب را تولید می کنند ، اما اگر درست باشند ، بزرگترین حرکت ها را پیش بینی می کنند. هنگام استفاده از این سیگنالها توصیه می شود از ریسک/پاداش حداقل ۲ یا بیشتر استفاده کنید.
بافر تداوم با یک پیکان کج نشان داده شده است. پیکان ادامه دار نشان می دهد که بازار در جهت مربوطه شتاب می گیرد. این سیگنالها اغلب در طی یک روند مداوم ظاهر می شوند و به عنوان نشانه ای حمایتی از ادامه روند فعلی بازار به شمار می روند. سیگنالهای تداوم پیش بینی های دقیق تری را ارائه می دهند ، اما حرکتهای بازار زیر اغلب بزرگ نیستند. توصیه می شود از این سیگنال ها برای افزودن به معاملات روند یا اسکالپ استفاده کنید.
بافر تأیید با یک پیکان ضخیم به بالا/پایین نشان داده شده است. پیکان تأیید زمانی ظاهر می شود که هر دو سیگنال معکوس و ادامه در طول یک شمع ظاهر شوند. این نشان دهنده یک حرکت بسیار محتمل است.
NB! همه تیرها در ابتدای شمعی که در آن قرار دارند ظاهر می شوند و دوباره رنگ نمی شوند!
پیکان های نشان داده شده می تواند یک سیستم تجاری مستقل باشد ، به این معنی که می توانید معاملات را با ظاهر شدن فلش ها انجام دهید. شما همچنین می توانید به سادگی از فلش ها برای تعیین احساسات بازار استفاده کنید زیرا تجزیه و تحلیل عملکرد قیمت پیش بینی کاملاً دقیقی را ارائه می دهد که در آن بازار احتمالاً در حال حرکت است.
Price Action Strength 2.0 بر روی همه نمادها و بازه های زمانی کار می کند ، اما توصیه می شود از آن در بازه های زمانی بزرگتر (H4 و بالاتر) استفاده کنید زیرا اصول تجزیه و تحلیل عملکرد قیمت هرچه بیشتر در بازه زمانی بهتر عمل کند.
ورودی ها
“دوره” – مقدار شمع هایی که نشانگر برای مقایسه داده های فعلی با آنها استفاده می کند.
“آستانه ۰ خط” – آستانه بافر “قدرت” که برای تعیین احساس تأیید/حرکت استفاده می شود.
“طول شمع های احساس حرکت” – طول شمع ها برای تشخیص احساس تأیید/حرکت است. اگر در حین این شمع ها ، بافر “قدرت” حداقل درصد معینی از تغییرات مثبت/منفی را ایجاد کرده باشد ، بازار دارای شتاب در این جهت است.
“احساس حرکت٪” -٪ تغییرات مثبت/منفی در بافر “قدرت” در طول بازه شمع ها با ورودی قبلی تنظیم شده برای تأیید حرکت در آن جهت.
‘اندازه فراکتال’ – اندازه فراکتال در یک جهت. این برای تعیین احساس پیش بینی/معکوس استفاده می شود.
“نوارهای تأیید ZigZag” – میزان بسته شدن مورد نیاز برای رعایت سطح ZigZag برای مقابله با رنگ آمیزی مجدد. از اصول نشانگر زیگزاگ برای تعیین شاخص استفاده می شودپیش بینی/تغییر احساسات
“عمق” – عمق برای شاخص ZigZag.
“انحراف” – انحراف برای شاخص ZigZag.
‘Backstep’ – پشت صحنه برای نشانگر ZigZag.
“یکبار نشان دهید” – اگر درست باشد ، پیکان ها باید جایگزین شوند. به عنوان مثال پس از ظاهر شدن یک پیکان تأیید صعودی ، باید یک پیکان تأییدی نزولی وجود داشته باشد تا یک پیکان تأیید صعودی جدید ظاهر شود. اگر نادرست باشد ، نشانگر تمام سیگنال های احساسی را که می تواند تشخیص دهد ، نشان می دهد.
“نمایش تغییر احساسات پیش بینی کننده” – در صورت صحت ، پیکانهای احساسات پیش بینی کننده در نمودار ظاهر می شوند.
“نمایش تغییر احساسات ادامه دار” – در صورت صحت ، پیکانهای احساس مداوم در نمودار ظاهر می شوند.
“نمایش تغییر احساسات تأیید کننده” – در صورت صحت ، پیکانهای احساسات تأییدکننده روی نمودار ظاهر می شوند.
“هشدارها” – در صورت صحت ، هنگامی که هر یک از فلش ها همراه با نام نمادی که رویداد روی آن رخ داده است ، نشانگر هشدار را به پایانه MT4 ارسال می کند.
‘Push notifications’ – در صورت صحت ، هنگامی که هر یک از فلش ها به همراه نام نمادی که رویداد روی آن رخ داده است ، نشانگر اعلان فشار ارسال می کند.
‘ایمیل’ – در صورت صحت ، وقتی یک پیکان به همراه نام نمادی که رویداد روی آن رخ داده است نشانگر ایمیل ارسال می کند.
Price Action Strength Indicator
Price Action Strength indicator uses the purest form of data available in the market (price action) to indicate the strength of the market move. Reading price action and measuring its strength is a subjective matter and it is a technique that takes years to master. The purpose of the indicator is to make the reading of the price action strength as objective as possible.
The indicator is far more advanced then default oscillators, because in addition to the price movement and its direction, the Price Action Strength indicator looks at the characteristics of the movement. This enables you to see the market through the eyes of an experienced price action trader.
The new version uses the same Price Action Strength values the 1.0 version did, but the 2.0 version determines the market sentiment for you. There are 2 possible sentiments:
- Predicting/reversal sentiment, which is calculated using the recent peaks/bottoms of the price compared to the Price Action Strength value;
- Continuation/momentum sentiment, which is calculated using the Price Action Strength momentum and value.
The new version uses these sentiment detections to produce arrows on the chart which show where the market is likely to move next using pure price action analysis.
There are 3 types of arrows/buffers with the new version (one for each direction) in addition to the 2 buffers that were included in the 1.0 version:
- Strength buffer will calculate the relative strength of the price action compared to the inputted ‘Period’ amount of past candles. The information is visualized using a line in the separate window. An upward movement of this line indicates a bullish price action strength while a downward movement of this line indicates a bearish price action strength. The higher this line is, the more bullish the price action strength is, the lower the line, the more bearish the price action strength;
- Overlap buffer will calculate the relative overlapping of the current bars compared to the inputted ‘Period’ amount of past candles. The information is visualized using a histogram. The higher the histogram, the stronger the price action strength considering the overlapping of the bars. In other words, the higher the histogram gets, the less overlapping exists between the bars, meaning the price has a concrete direction and it doesn’t range, which indicates a strong move;
- Reversal buffer is indicated with a thin upwards/downwards arrow. The reversal arrow indicates that the reversal of the price is likely. Reversal signals are the ones that produce the most false signals, but if correct, they predict the biggest moves. It is recommended to use a risk/reward of at least 2 or bigger when taking these signals;
- Continuation buffer is indicated with a slanted arrow. The continuation arrow indicates that the market is gaining momentum in the corresponding direction. These signals often appear during an ongoing trend and are meant as a supportive indication that the market will more likely continue on the current course. Continuation signals provide more accurate predictions, but the market moves following are often not huge. It is recommended to use these signals for adding on to trend trades or scalps;
- Confirmation buffer is indicated with a thick upwards/downwards arrow. The confirmation arrow shows up when both the reversal and continuation signals appears during the same candle. This indicates a highly probable move.
NB! All The Arrows Appear At The Start Of The Candle They Locate On And Will Not Repaint!
The arrows shown by the indicator can be a stand-alone trading system, meaning you can take the trades as the arrows appear. You can also simply use the arrows to determine the market sentiment since price action analysis gives a pretty accurate prediction where the market is likely headed.
Price Action Strength 2.0 works on all the symbols and timeframes, but it is recommended to use it on bigger timeframes (H4 and up) since price action analysis principles work better the bigger the timeframe.
The inputs
- ‘Period‘ – the amount of candles the indicator uses to compare the current data to.
- ‘۰-line threshold‘ – the threshold for the ‘Strength’ buffer which is used to determine the confirming/momentum sentiment.
- ‘Momentum sentiment candles span‘ – the candles span for detecting the confirming/momentum sentiment. If during these candles the ‘Strength’ buffer has made at least a certain % of positive/negative changes, the market is considered having a momentum in that direction.
- ‘Momentum sentiment %‘ – the % of positive/negative changes in the ‘Strength’ buffer during the candles span set with the previous input required to confirm a momentum in that direction.
- ‘Fractal size‘ – the fractal size in one direction. This is used to determine the predicting/reversal sentiment.
- ‘ZigZag confirmation bars‘ – the amount of closes required for the ZigZag level to be respected to cope with the repainting. ZigZag indicator principles are used to determine the predicting/reversal sentiment.
- ‘Depth‘ – the depth for the ZigZag indicator.
- ‘Deviation‘ – the deviation for the ZigZag indicator.
- ‘Backstep‘ – the backstep for the ZigZag indicator.
- ‘Show once‘ – if true, the arrows need to alternate. For example after a bullish confirmation arrow appears, there has to be a bearish confirmation arrow present until a new bullish confirmation arrow can appear. If false, the indicator shows all the sentiment signals it can detect.
- ‘Show predicting sentiment change‘ – if true, the predicting sentiment arrows appear on the chart.
- ‘Show continuation sentiment change‘ – if true, the continuing sentiment arrows appear on the chart.
- ‘Show confirming sentiment change‘ – if true, the confirming sentiment arrows appear on the chart.
- ‘Alerts‘ – if true, the indicator sends an alert notification to the MT4 terminal when any of the arrows appear along with the symbol name the event happened on.
- ‘Push notifications‘ – if true, the indicator sends a push notification when any of the arrows appear along with the symbol name the event happened on.
- ‘Emails‘ – if true, the indicator sends an email when any of the arrows appear along with the symbol name the event happened on.
تماس و واتس آپ اکسپرت سفارشی: ۰۷۷۳۳۴۳۳۲۱۱ – ۰۹۹۲۹۱۶۹۳۰۷
برچسب ها: سفارش ساخت ربات فارکس و ساخت ربات معامله گر بورس و ساخت ربات معاملاتی و طراحی ربات تریدر و ربات فارکس رایگان و برنامه نویسی ربات فارکس و آموزش ساخت اکسپرت فارکس و ساخت ربات معامله گر با پایتون و دانلود ربات معامله گر فارکس و خرید ربات تریدر فارکس و ربات فارکس خودکار و ربات معامله گر بورس رایگان و آموزش ساخت ربات معامله گر فارکس و دانلود ربات معامله گر بورس ایران و ربات معامله گر آلپاری و ربات فارکس برای اندروید و طراحی ربات متاتریدر و برنامه نویسی ربات متاتریدر و طراحی ربات فارکس و برنامه نویسی ربات فارکس و تجارت خودکار

